FAST DOWNLOADads
Here is a simple Microsoft Office tutorial using Microsoft Excel to create a 3-D Line Chart.
You just need some sample data entered into a Microsoft Excel Worksheet and acting upon the steps provided in this Microsoft Excel Tutorial on Developing a 3-D Line Chart. The procedure is simple and explained with the help of clear and big images so that you can understand easily How to create a 3-D Line chart.
Step 1: Start MS Excel
Start Microsoft Excel with a new blank Excel Workbook. You will use the very first
Microsoft Excel Worksheet for entering data and creating a 3-D Line chart.
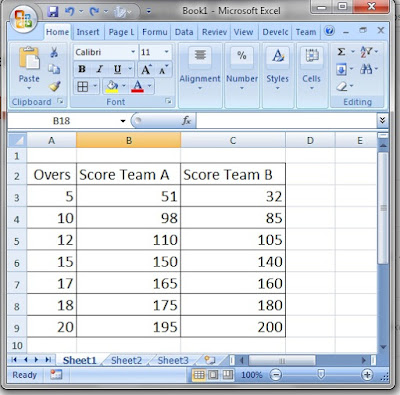
Step 2: Type Sample Data for 3D Line Chart in Excel Worksheet
Type data of two cricket teams as shown in the figure. Type data in 3 columns, Overs, Scores Team
A, and Scores Team B.
 |
| Create 3 D line Chart in Microsoft Excel Easy Steps |
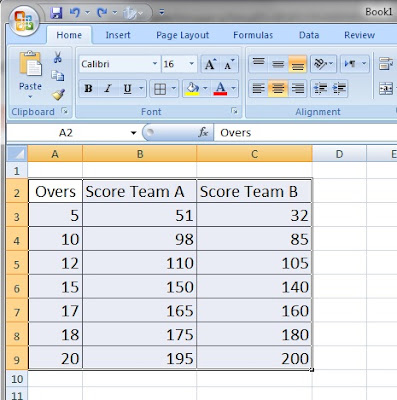
Step 3: Select Data for 3D Line Chart
Select all data including the three columns from Overs to Score Team B.
 |
| Select Data Create 3 D line Chart in Microsoft Excel Easy Steps |
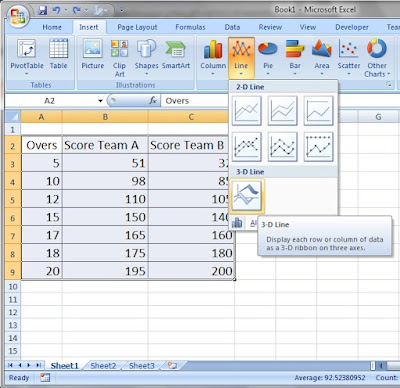
Step 4: Click on Insert Tab
Click on Insert tab. Click on
Line chart.
 |
| Click Insert Tab |
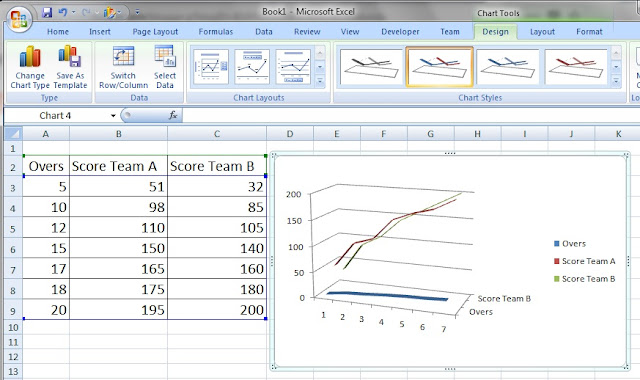
Step 5: Select 3-D Line Chart (Chart Type)
Select 3-D line chart from available chart type options.
 |
| Select 3-D Line Chart Type |
Step 6: Select Chart Layout
Select a chart layout as shown in the figure. You will get the required 3-D line Chart in Microsoft Excel for analysis of scores two cricket teams time to time with respect to overs played.
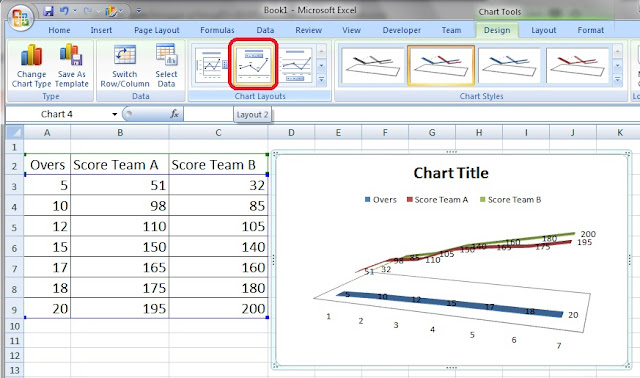 |
| Develop a 3-D Line Chart in Microsoft Excel Worksheet - Select Chart Layout |
Using Simple Formulas in Excel With Arithmetic Operators 2 FAST DOWNLOADads


